Calculators
Likes Per View Calculator — Turn Likes Into a Real Engagement Signal
Divide likes by views to find your likes-per-view percentage in seconds. See whether your audience truly enjoys your videos or is just clicking through.
Likes Per View Calculator
Turn likes into a percentage of views and benchmark how strongly your audience reacts.
Likes per view = likes ÷ views × 100. Most channels land between 4–8%.
Like rate
0.00%
400 likes ÷ 5,000 views
Introduction
Likes are the cheapest, most instinctive engagement on YouTube — a viewer clicks a thumb without typing a word, scrolling, or committing to a comment. Because they cost so little effort, a video's likes-per-view percentage is a sharp early signal of whether the content actually landed. Divide likes by views and multiply by 100, and you get a figure that separates videos your audience loved from videos they tolerated. The Thumbix Likes Per View Calculator does that division for you and shows which band your video sits in, so you can see at a glance whether your content quality is trending up or down.
How to use Likes Per View Calculator
Open the tool
Go to thumbix.site and open the Likes Per View Calculator.
Enter the likes
Copy the like count from the video you want to analyze.
Enter the views
Use the view count shown on the same video.
Read your percentage
The likes-per-view figure appears instantly with its band.
Compare a second video
Rerun the tool to rank your recent uploads by engagement.
Adjust your strategy
Double down on formats that clear the good-to-excellent bands.
What Is This Tool?
The Likes Per View Calculator takes the likes on a video and its view count, then expresses likes as a percentage of views so you can compare any two videos on equal terms.
Because the result is a percentage rather than a raw count, a 200-like video and a 20,000-like video can finally be compared fairly — what matters is the share of viewers who were moved enough to click.
Why Use This Tool?
- You benchmark your content honestly — raw like counts favor big channels, but percentages level the playing field.
- You catch quality problems early, because likes-per-view falls weeks before watch time does.
- You compare videos within your own library to see which formats your audience responds to best.
- You give sponsors a simple, credible engagement stat that is hard to fake with bought views.
- You get the answer in seconds without touching a spreadsheet or calculator app.
Who Should Use This Tool?
- Creators who want a fast quality check on every new upload.
- Channel managers comparing performance across a portfolio of videos.
- Brands evaluating an influencer's genuine audience sentiment before a deal.
- YouTube beginners learning which video ideas resonate with viewers.
- Analytics lovers who want a cleaner metric than raw like counts.
How Does It Work?
- You enter the number of likes a video has received.
- You enter the total views that video has accumulated.
- The calculator divides likes by views and multiplies by 100 to show the percentage.
- The result updates instantly, so you can check a whole playlist in under a minute.
Real-World Use Cases
- The upload review. A creator checks the likes-per-view figure on the morning after publishing and knows within a day whether the video clicked.
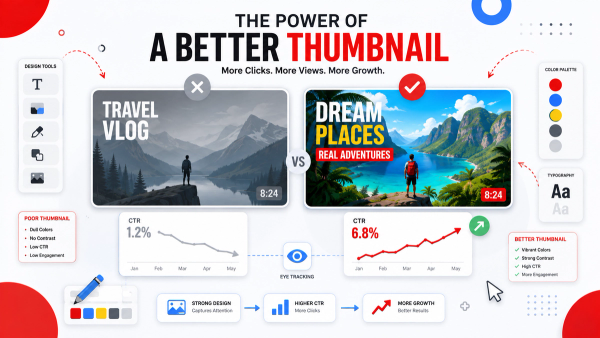
- The format test. A channel compares two videos on the same topic with different thumbnails and sees which one earned a higher like share.
- The influencer screen. An agency runs a candidate creator's recent videos through the tool and rejects anyone with a consistently low ratio.
- The content pivot. A cooking channel discovers its recipe walkthroughs hit 8% while its vlogs sit at 3%, and doubles down on recipes.
The Formula
The likes-per-view percentage divides likes by views and scales the result to a percentage.
Likes per view = likes ÷ views × 100
Enter the likes and views for any video, and the calculator returns the percentage of viewers who clicked like. The same math works for a whole channel: total likes divided by total views gives your channel-wide engagement baseline.
Step-by-Step Calculation
- Step 1 — Open the video in YouTube and note its like count.
- Step 2 — Note the same video's total view count.
- Step 3 — Divide the likes by the views.
- Step 4 — Multiply the result by 100 to express it as a percentage.
- Step 5 — Compare the percentage against the benchmarks below.
Worked Example
A video earned 400 likes on 5,000 views. The calculation is 400 ÷ 5,000 × 100 = 8%. That figure lands in the excellent band, meaning roughly one in twelve viewers was engaged enough to click the thumbs-up icon.
For contrast, the same channel's next video earned 250 likes on 5,000 views — a 5% ratio. Both videos got identical traffic, but the first clearly connected far better with its audience.
Interpreting the Result
- Above 8% is excellent — your audience is responding strongly and the content is landing.
- Between 6% and 8% is good — solid engagement and a healthy baseline.
- Between 4% and 6% is average — viewers watch but are not strongly moved.
- Below 4% is low — worth investigating your topic, packaging, or audience fit.
Trend matters more than a single video. If your last ten uploads have climbed from 4% to 7%, your content is improving; if they have slid from 7% to 4%, something is losing its connection with viewers.
Edge Cases and Gotchas
- Newly published videos move fast — the ratio stabilizes as the initial wave of enthusiastic viewers mixes with the general audience.
- Short-form and long-form content are not directly comparable, because Shorts viewers behave differently from long-form viewers.
- View counts from third-party apps can be stale; use the number shown on YouTube itself.
- A dislike-to-like shift or a controversy can distort the percentage in ways that do not reflect video quality.
Why Likes Per View Matters More Than You Think
YouTube uses engagement signals to decide which videos to promote, and likes are among the cheapest signals a viewer can give. A high likes-per-view percentage tells the recommendation system that people genuinely enjoyed the video, which encourages broader distribution. Over time, the videos with the best like-to-view ratios are the ones the algorithm keeps recommending long after upload day.
That makes the metric doubly useful: it measures whether the audience is satisfied, and it predicts whether YouTube will keep sending new viewers. A rising ratio is a leading indicator of growth, not a lagging report card.
How to Improve Your Likes Per View
- Make the first thirty seconds genuinely valuable, because viewers decide how they feel about a video very quickly.
- Ask for the like at a natural moment — after delivering a key payoff, not before it.
- Deliver exactly what the title and thumbnail promise; mismatched packaging depresses engagement fast.
- Analyze your best-performing videos and reverse-engineer what they have in common.
- Stay consistent in format so your audience builds an expectation of quality they want to endorse.
Best Practices
- Judge videos only after they have had a few days to accumulate a stable audience.
- Compare like-with-like — long-form against long-form, Shorts against Shorts.
- Track a rolling average over your last ten videos instead of one upload.
- Pair the percentage with the Comments Per View Calculator for a fuller engagement picture.
A like is a cheap signal, which is exactly why it is a good one — if viewers click it even when it costs them nothing, the content must be working.
Reading the Benchmark Bands
The bands in the Likes Per View Calculator map a raw percentage onto how YouTube audiences actually behave. Above 8% is excellent — viewers are actively endorsing the video, which is the strongest signal the platform sees before watch time takes over. Six to eight percent is good: the audience is engaged and the content is on target. Four to six percent is average, roughly where most healthy channels land, and below 4% is low, which usually points to a packaging or topic mismatch rather than a quality collapse.
The bands are guides, not laws. A small channel with a loyal subscriber base often sits above 8% because its audience arrives already enthusiastic, while a massive viral upload can sit below 4% because it reaches millions of casual viewers who never like or subscribe. That is why the tool compares like-with-like: judge your newest upload against your own recent history, and let the trend line — not a single video — decide what counts as normal for you.
Frequently Paired Thumbix Workflows
Engagement is a family of metrics — combine them for the full story.
- Likes Per View Calculator → Comments Per View Calculator. See whether viewers are reacting, and whether they are talking.
- Likes Per View Calculator → YouTube Engagement Rate Calculator. Get a single overall engagement number for sponsors.
- Likes Per View Calculator → Views Per Subscriber Calculator. Confirm that new audiences are also engaged audiences.
- Likes Per View Calculator → CTR Goal Calculator. Lift the clicks into the video and watch the like share follow.
Conclusion
Raw likes flatter big channels; the likes-per-view percentage tells the truth about how your content connects. Run each upload through the Thumbix Likes Per View Calculator, watch the trend across your last ten videos, and use the benchmark bands to know exactly when to celebrate and when to course-correct. Free, instant, and built for the way creators actually work.
Common Mistakes to Avoid
- Comparing raw like counts across channels of different sizes.
- Judging a video hours after publishing before the audience stabilizes.
- Mixing Shorts and long-form videos in the same comparison.
- Ignoring the trend and reacting to one unusually high or low video.
- Treating likes as the only signal instead of pairing them with comments and CTR.
Frequently Asked Questions
Divide the video's likes by its views and multiply by 100. For example, 400 likes on 5,000 views equals 8%.
Above 8% is excellent, 6 to 8% is good, 4 to 6% is average, and below 4% is low.
Likes are a cheap engagement signal that YouTube uses to judge satisfaction and decide which videos to keep recommending.
Yes — that is the whole point. The percentage removes the size advantage and compares audience reaction directly.
Common causes are a mismatch between thumbnail, title, and content, weak opening minutes, or simply a topic your audience does not care about.
No — Shorts viewers engage differently, so keep the two formats in separate comparisons.
Let the video accumulate a few days of normal traffic so the early enthusiast wave settles into a representative ratio.
Both matter — views show reach and likes per view shows quality. High views with a low ratio means reach without resonance.
The ratio uses likes only, but a heavy dislike shift can signal audience mismatch that the like percentage alone will not reveal.
Yes — sponsors use it to screen influencers for genuine audience sentiment before committing to a deal.
Yes, completely free with no account required.
Just two numbers: the video's likes and its view count.
Keep exploring
Find out what your likes really say
Enter likes and views to compute your engagement percentage instantly — free, private, and made for creators.
Try the Likes Per View Calculator